Quicklinks to page section:
- Tinley Park property tax breakdown
- Look up your effective property tax rate
- Village & School Pension/OPEB Liabilities
- We have the most taxing units of government in the country
- Illinois property taxes vs. neighboring states property taxes
- The County owns your house
- The fight for the taxpayers' future
- Recent news articles
- Tinley Park burdens homeowners
- Neighboring towns pay 30-60% less in property taxes
- WAYS TO PROTEST/APPEAL YOUR REAL ESTATE TAXES
|
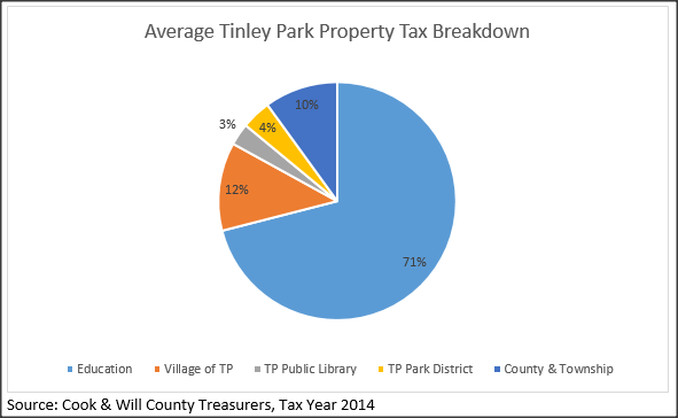
Tinley Park property tax breakdown
Tinley Park Property Tax Rates have DOUBLED in the past 10 years. What is being done to control costs? Illinois has the second highest property taxes in the nation. Click here for the article. |
Property Tax Breakdown
We have included documents below that are helpful in understanding property taxes and where our tax dollars are being spent. In many cases tax rates have doubled+ in less than 10 years!
Source: Cook County Treasurer Village of Tinley Park 2015 Report. See Pages 204-208, 212, 217, 222 and 227 if looking by source.
Why people and businesses are moving, especially out of Cook county...
Village & School District Pension Liabilities, etc.
Interesting Findings
- District 159 operates on a budget that is over $26 MILLION more than District 145.
- The Village of Tinley Park has almost 2.5X it's annual operating budget as a cumulative fund balance (of taxpayer dollars).
- District 140 reports a 7.08% pension fund ratio, making taxpayers in this District liable for nearly 93% of the pension fund debt.
- District 210 and 228 rank among the highest deficit spenders in Illinois. Click Here to read an article highlighting this issue and read below for additional details.
- The Village of Tinley Park, TP Park District and even the TP Police Department have low pension fund ratios, creating a higher tax levy situation for taxpayers in the coming years.
- The annual salary increase for employees with the Village of Tinley Park and the TP Park District is 4%.
- Annual salary increases in the Village and ALL local school districts exceed the annual rate of inflation. District 145 and 228 is at the highest annual salary rate increase of 5.75%, and no school district is below a 3.75% annual salary increase per year.
- The health care cost "trend" in the Village and ALL local school districts is between 7.5-8%, requiring a higher tax levy every year.
- The TP Park District, District 159 and District 227 school districts are NOT REQUIRED to report unfunded OPEB (other post-employment benefits - i.e. health ins), which skews their actual unfunded liability numbers.
- Local School Districts annually increase their tax levy even though all but one district (210) carries large surpluses in their reserves. It's concerning that schools are retaining so much TAXPAYER dollars in their accounts as a reserve.
- Based on student enrollment, the reported FTE staff count (per the Cook County Treasurer Reports, provided below) and ISBE report of Teacher/Admin count (provided below) shows that schools may be over-staffed, costing taxpayers unnecessary salaries and benefits of personnel. There are large staff discrepancies between the School Districts. More in-depth reporting by school districts is necessary to properly audit, and currently, this type of reporting is not required by the State.
VillageVillage of Tinley Park
Pension/OPEB Funded Ratio: 60.95% (see page 3-4 below) Operating Budget 2015: $53,291,806 Year-End 2016 Fund Balance: $122,329,792 (see page 2) Total Agency Employees or Full-Time Equivalents: 469 Annual Rate of Salary Increases: 4.00% Health Care Cost Trend Rate: 7.50% Tinley Park Police Department Pension Fund Ratio as of May 2015: 71.1% Year-End 2015 Fund Balance: $59,535,644 (see page 218) Tinley Park Park District Pension Funded Ratio: 70.62% - This District is NOT required to report any OPEB (Other Post-Employment Benefits) in its Financial Statements. The ratio reported is not including unfunded benefits. (see page 5-6 below) Operating Budget 2015: $9,245,948 Total Agency Employees or Full-Time Equivalents: 30 Annual Rate of Salary Increases: 4.00% Health Care Cost Trend Rate: Not required to report Elementary SchoolsDistrict 140
Pension/OPEB Funded Ratio: 7.08% (see page 7-8 below) Operating Budget 2016: $53,901,500 Year-End 2015 Fund Balance: $51,983,041 (see page 26) Total Agency Employees or Full-Time Equivalents (FTE): 537 District FTE count per Pupil: 6.75 ISBE Report Count of Teachers/Admin: 271 IBSE count per Pupil: 13.37 Difference between FTE and ISBE count: 266 Annual Rate of Salary Increases: 3.00% Health Care Cost Trend Rate: 8.00% 3,623 enrolled students District 145 Pension/OPEB Funded Ratio: 74.37% (see page 9-10 below) Operating Budget 2015: $16,256,691 Year-End 2016 Fund Balance: $6,342,015 (see page 19) Total Agency Employees or Full-Time Equivalents (FTE): 216 District FTE count per Pupil: 6.73 ISBE Report Count of Teachers/Admin: 97 IBSE count per Pupil: 14.99 Difference between FTE and ISBE count: 119 Annual Rate of Salary Increases: 5.75% Health Care Cost Trend Rate: 7.50% 1,454 enrolled students District 146 Pension/OPEB Funded Ratio: 90.98% (see page 11-12 below) Operating Budget 2015: $38,458,921 Year-End 2015 Fund Balance: $33,446,715 (see page 38) Total Agency Employees or Full-Time Equivalents (FTE): 393 District FTE count per Pupil: 6.15 ISBE Report Count of Teachers/Admin: 242 IBSE count per Pupil: 9.98 Difference between FTE and ISBE count: 151 Annual Rate of Salary Increases: 3.75% Health Care Cost Trend Rate: 8.00% 2,416 enrolled students District 159 Pension Funded Ratio: 91.21% - This District is NOT required to report any OPEB (Other Post-Employment Benefits) in its Financial Statements. The ratio reported is not including unfunded benefits. (see page 13-14 below) Operating Budget 2015: $42,710,019 Year-End 2016 Fund Balance: $18,027,291 (see page 19) Total Agency Employees or Full-Time Equivalents (FTE): 298 District FTE count per Pupil: 6.53 ISBE Report Count of Teachers/Admin: 319 IBSE count per Pupil: 6.10 Difference between FTE and ISBE count: 74 Annual Rate of Salary Increases: 4.00% Health Care Cost Trend Rate: Not required to report 1,947 enrolled students District 161 Research pending on this Will County district. Year-End 2016 Fund Balance: $15,632,229 (see page 20) 3,283 enrolled students |
High SchoolsDistrict 210
Pension/OPEB Funded Ratio: 85.02% (see page 15-16 below) Operating Budget 2015: $114,165,116 Year-End 2016 Fund Balance: $1,886,696 (see page 20) Total Agency Employees or Full-Time Equivalents (FTE): 842 District FTE count per Pupil: 8.46 ISBE Report Count of Teachers/Admin: 463 IBSE count per Pupil: 15.39 Difference between FTE and ISBE count: 379 Annual Rate of Salary Increases: 3.00% Health Care Cost Trend Rate: 8.00% 7,126 enrolled students District 227 Pension Funded Ratio: 93.17% - This District is NOT required to report any OPEB (Other Post-Employment Benefits) in its Financial Statements. The ratio reported is not including unfunded benefits. (see page 17-18 below) Operating Budget 2015: $58,203,831 Year-End 2016 Fund Balance: $30,089,209 (see page 18) Total Agency Employees or Full-Time Equivalents (FTE): 576 District FTE count per Pupil: 5.73 ISBE Report Count of Teachers/Admin: 255 IBSE count per Pupil: 12.95 Difference between FTE and ISBE count: 321 Annual Rate of Salary Increases: 4.00% Health Care Cost Trend Rate: Not required to report 3,303 enrolled students District 228 Pension/OPEB Funded Ratio: 88.35% (see page 19-20 below) Operating Budget 2015: $86,609,537 Year-End 2016 Fund Balance: $47,140,213 (see page 19) Total Agency Employees or Full-Time Equivalents (FTE): 583 District FTE count per Pupil: 8.91 ISBE Report Count of Teachers/Admin: 338 IBSE count per Pupil: 15.37 Difference between FTE and ISBE count: 245 Annual Rate of Salary Increases: 5.75% Health Care Cost Trend Rate: 7.50% 5,196 enrolled students District 230 Pension/OPEB Funded Ratio: 75.93% (see page 21-22 below) Operating Budget 2015: $123,806,276 Year-End 2016 Fund Balance: $60,843,567 (see page 20) Total Agency Employees or Full-Time Equivalents (FTE): 836 District FTE count per Pupil: 9.31 ISBE Report Count of Teachers/Admin: 567 IBSE count per Pupil: 13.73 Difference between FTE and ISBE count: 269 Annual Rate of Salary Increases: 3.75% Health Care Cost Trend Rate: 7.50% 7,786 enrolled students School Deficit Spending in 2016In fiscal year 2016, the following Tinley Park School Districts ranked among the highest in school district deficit spending in Illinois:
Related Articles
|
What does all of this data mean?
There is no possibility of our property taxes, or Illinois taxes to be reduced based on the annually increasing costs of Village and School District salary/benefit costs. Our Village and School Districts also carry unfunded liabilities, and in some cases large unfunded liabilities, which are leaving taxpayers on the hook for increased tax levies to bring these funds to acceptable levels. Taxpayers are also liable for the bonds that the Village and Schools receive, and all of the financial risks that the Village and Schools expose taxpayers to. The way of Municipal and State management needs to be restructured into a fiscally responsible business model with: less government bloat, realistic salaries and benefits, standardized reporting for in-depth auditing, more transparency and better oversight. The local government's way of the past, and especially the Village and School District spending boom between 2000-2015+ set us on a terrible course with no way to truly recover unless spending is reduced and costs are capped - making tax burdens a much smaller and more manageable percentage of taxpayer income (and also more in line with neighboring States).
We have the most units of local (taxing) govt. in the COUNTRY
Illinois has nearly 7,000 units of local government. That’s the highest count of any state in the nation, and the runner-up is not even close. One of those units of government is the Naperville Township Road District, where seven employees maintain less than 20 miles of road at a cost of $116,000 per mile. City officials have said they could maintain the same distance at half the cost, and have moved to take over the road district’s duties on behalf of local taxpayers.
But the final decision on whether to outsource maintenance of those roads to the city rests with Naperville Township Road Commissioner Stan Wojtasiak, who has put local taxpayers on the hook for thousands of dollars in meals and treats, including alcohol, over the course of his tenure, according to the Naperville Sun. Wojtasiak said he spent the money to boost staff morale, and has yet to announce his decision regarding consolidation.
The Naperville case is emblematic of a statewide problem in Illinois: Having thousands of local governments poses serious problems when it comes to oversight and efficiency.
The result of the status quo? Illinois property taxes are the third-highest in the nation, according to the Tax Foundation, which also predicts Illinois will soon overtake New Jersey as the state with the highest property taxes. Many homeowners in Illinois are now paying twice for their houses over their lifetimes — once to the bank, and once to the government through property taxes.
A look into the nature of local spending in Illinois reveals big opportunities for sorely needed property-tax savings through government consolidation, and also shows the high costs shouldered by Illinoisans due to decades of political inaction.
But the drama over a few miles of Naperville pavement illustrates how the road to consolidation is often littered with obstacles.
One bipartisan bill being considered in Springfield would help smooth the consolidation process for many local governments. House Bill 4501 would allow county boards to dissolve certain units of local government via ordinance, a power already enjoyed by DuPage County.
While this is a step in the right direction, local governments will need more than the powers granted by HB 4501 to tackle major cost drivers to prevent property-tax bills from growing even higher.
For example, prime candidates for consolidation are Illinois’ 859 local school districts, which consume nearly two-thirds of the $27 billion in local property taxes collected across the state each year. According to data from the Illinois State Board of Education, a quarter of Illinois school districts serve only a single school, a third serve fewer than 600 students, and more than 40 percent serve only one or two schools.
Forthcoming research from the Illinois Policy Institute shows that reducing the number of school districts by half could lead to annual operating savings of $130 million to $170 million and could conservatively save the state $3 billion to $4 billion in pension costs over the next 30 years. In terms of the number of school districts per student, the move would put Illinois between California and Texas.
Beyond consolidating small school districts, many larger communities would be well-served by merging elementary school districts with high school districts.
The Homewood-Flossmoor area is home to two K-8 school districts and a high school district, an inefficient setup mirrored across the state. Instead of having a single “unit” school district that covers all schools in the area, taxpayers shoulder the burden of three separate administrative staffs, which contain duplicative and overlapping positions.
The base salaries of all three districts’ staffs cost Homewood-Flossmoor-area taxpayers nearly $5 million a year. By consolidating those three staffs into one, Homewood-Flossmoor could save local taxpayers millions of dollars annually. Consolidating the three superintendent positions into one would alone save $500,000 each year.
Consolidation focused on cutting unnecessary costs from school-district administration — and not on equalizing salary contracts or funding new facilities, as has plagued similar efforts in the past — is a fair and necessary step in communities across Illinois.
The same goes for road districts, mosquito-abatement districts, park districts, library districts and more.
But as long as state and local politicians fail to trim Illinois’ glut of government units, taxpayers will continue to be crushed under the weight of ever-higher costs. Transparency, accountability and fiscal responsibility all depend on consolidation in Illinois.
https://www.illinoispolicy.org/illinois-will-soon-overtake-new-jersey-as-the-state-with-the-highest-property-taxes/
Illinois vs. Neighboring States
Illinois’ property tax rates have skyrocketed since 2010, according to new analysis done by the Tax Policy Center. The survey examined the 23 Illinois counties with populations exceeding 65,000.
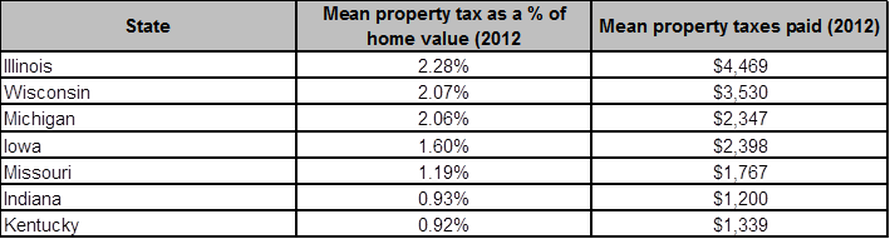
The average property tax rates as a percent of home value has soared from 1.93 percent in 2010 to 2.28 percent in 2012. This represents an 18 percent property tax rate increase in just two years. This rate spike is due to declining home values and local taxing bodies increasing property tax levies.
The average property tax rates as a percent of home value has soared from 1.93 percent in 2010 to 2.28 percent in 2012. This represents an 18 percent property tax rate increase in just two years. This rate spike is due to declining home values and local taxing bodies increasing property tax levies.
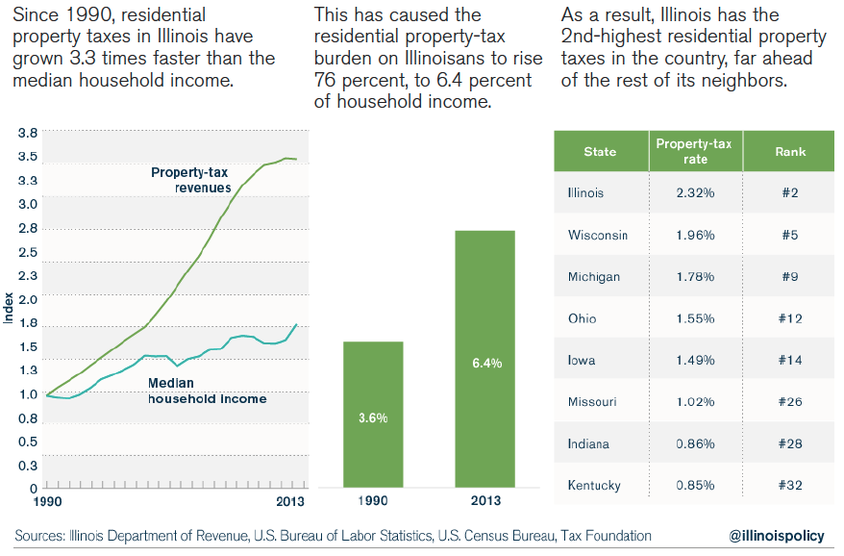
Illinois’ property tax rate is second only to the rate New Jersey residents pay, which is 2.32 percent annually.
A tax rate of 2.28 percent is equivalent to paying $6,840 in annual property taxes on a $300,000 home. According to the Tax Policy Center, the average Illinoisan had an annual property tax bill of $4,469 in 2012.
This is in stark contrast to the rest of the country. The Tax Policy Center concluded “… the bulk of counties levy property taxes that are around $1,000 per homeowner and below 1 percent of house value.
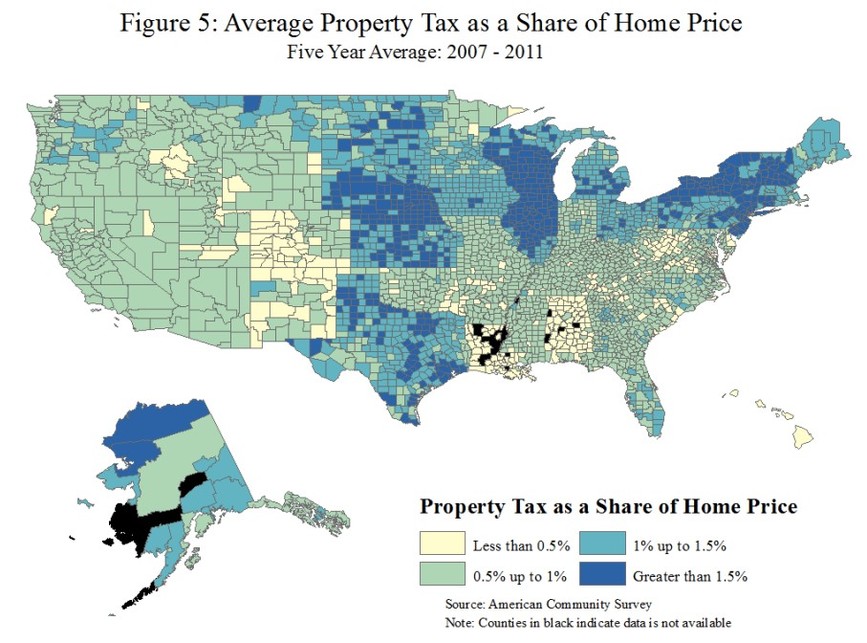
Illinois’ high property tax trend has been going on for some time. For the five-year period of 2007-2011, Illinois stands out as one of a few states that saw a majority of its counties asking citizens to pay a property tax rate of more than 1.5 percent.
Illinois officials must do better in controlling the property tax burden on residents and businesses, or else the state’s economy will suffer and Illinois will continue to lose residents to other states. From 1995 to 2009, Illinois lost 806,000 people to out-migration and $26 billion in taxable income.
In other states, hard property tax caps have helped limit property tax bills from growing uncontrollably. In 2010, Indiana voters passed a constitutional amendment that limited property taxes to “one percent for residential homesteads, two percent for commercial property and second homes, and three percent for industrial and agricultural property.”
By empowering voters to limit the taxing and borrowing powers of local governments, Indiana has successfully held the average property tax rate below 1 percent.
Hard property tax caps such as Indiana’s are long overdue for the residents of Illinois.
Source: http://www.illinoispolicy.org/property-tax-rates-skyrocket-in-illinois-2nd-highest-in-u-s/
The County Owns YOUR House
As homeowners and taxpaying citizens of Tinley Park, we are astounded at the amount of property taxes local residents are paying. Our property tax rates are beyond the highest rates in Illinois that statistics are reporting.
There is a Bremen Township Tinley Park condominium valued at $150,000 with a property tax bill of $7,500. That is an annual property tax of 5%, more than twice the highest property tax rate in the nation. Tinley Park has failed us."
It's evident that the governing taxing bodies have targeted those with real estate holdings (your house or business investment) to extort the majority of their revenue source, which they frivolously spend and use to line their pockets... at the direct threat of your largest investment. For those with the goal to pay off a mortgage, you will never "own" your home or property since failure to pay your property taxes ultimately results in the tax sale (foreclosure) of your home. You are forever obligated to cover the annual budgets of the village, schools and municipalities. If you pay real estate taxes, you are a slave to the government. It is in every property taxpayers' best interest to ensure that the local government is operating as lean and economical as possible. Furthermore, as taxpayers we should all demand that the burden of tax revenue be shifted away from our real estate holdings.
In addition, some residents noticed a discrepancy between the property taxes of a condo building (owned) and an apartment complex (rented). Condo unit owners collectively pay much more than an apartment complex. Why is that? Apartment complexes should be paying the same amount of property taxes as a comparable sized condominium complex. Apartment residents utilize the same schools and municipality as homeowners and the rental property owners should be contributing the same amount as condominium complexes and homeowners.
In addition, some residents noticed a discrepancy between the property taxes of a condo building (owned) and an apartment complex (rented). Condo unit owners collectively pay much more than an apartment complex. Why is that? Apartment complexes should be paying the same amount of property taxes as a comparable sized condominium complex. Apartment residents utilize the same schools and municipality as homeowners and the rental property owners should be contributing the same amount as condominium complexes and homeowners.
The fight for the taxpayer's future
The amount of money taxpayers pay in property taxes [above the national average] should be going into their retirement accounts, or paying down a mortgage/debt, or just into another investment. Instead, tax dollars are being squandered year after year by our "public servants" with results no better than states across the U.S. with MUCH LOWER property tax rates. Other states have managed their villages and schools with lower property tax rates, why can't we? Illinois is no different or special than the other States. Taxpayers in Illinois are going to realize the cost of high taxes as they continue to age, where money went to pay government graft instead of going into their retirement and savings like it should have. The struggle of today is nothing compared to the affect high taxes will have on the people of this State in the future.
To highlight this topic, lets say a $200,000 house in Illinois has a 3% property tax due each year (which is actually LOW in Tinley Park), equating to a $6,000 property tax bill each year. If Illinois had a lower 1.5% property tax rate (similar to other US States), the taxpayer would save $3,000 per year. This $3,000 invested per year, at a 5% rate of return, would yield a taxpayer $209,282 over the span of 30 years. How much money are you content with entrusting to the State, the Village and the School Districts? Are they spending your money wisely?
To highlight this topic, lets say a $200,000 house in Illinois has a 3% property tax due each year (which is actually LOW in Tinley Park), equating to a $6,000 property tax bill each year. If Illinois had a lower 1.5% property tax rate (similar to other US States), the taxpayer would save $3,000 per year. This $3,000 invested per year, at a 5% rate of return, would yield a taxpayer $209,282 over the span of 30 years. How much money are you content with entrusting to the State, the Village and the School Districts? Are they spending your money wisely?
Recent News Articles
We can't keep up with the news articles coming out about the property tax problem and financial mess facing all Illinoisans. Here are just a few articles highlighting the massive problem we face due to irresponsible and reckless state and municipal spending.
We've legalized and systematized a different kind of fraud on a magnificent scale, and taxpayers are funding outrageous benefits for a privileged class of public workers." - Ted Slowik, Tribune Publishing
We need more than the proposed state property tax freeze. WE NEED A PROPERTY TAX REDUCTION!
Tinley's Property Tax Burden
Tinley Park brings in nearly the same amount of sales tax revenue as comparably populated neighboring communities. What stands out is Tinley Park's property tax revenue, which is TRIPLE Orland Park's and nearly DOUBLE Oak Lawn's, according to the documents below. Also, despite the surpluses many School Districts and Village entities report, the "Direct and Overlapping Governmental Activities Debt" data from the Village's 2015 Financial Report (included below) shows the amount of debts paid from property taxes. The property tax burden on Tinley taxpayers must be reduced if this community wishes to retain residents and gain businesses.
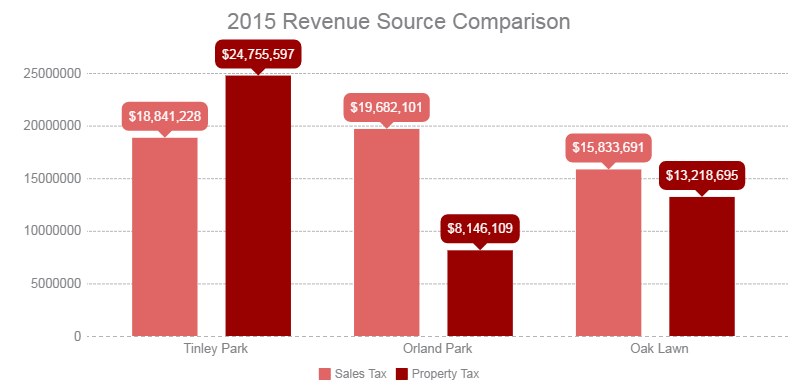
Tinley ParkPopulation: 57,282
2015: Sales Tax Revenue: $18,841,228 Property Tax Revenue: $24,755,597 Property Tax Rebates Available: NO |
Orland ParkPopulation: 58,592
2015: Sales Tax Revenue: $19,682,101 Property Tax Revenue: $8,146,109 Property Tax Rebates Available: YES |
Oak LawnPopulation: 57,073
2015: Sales Tax Revenue: 15,833,691 Property Tax Revenue: 13,218,695 Property Tax Rebates Available: NO |
Property taxes paying Local Government debts
Neighboring Towns Pay 30-60% Less
Comparable houses in Orland Park and Oak Lawn pay, in most cases, 30-60% less in property taxes than Tinley Park residents. All 3 communities have nearly the same amount of residents paying into the system. To avoid using private citizens home addresses for property tax comparisons, you can check the "recent homes sold" sections of popular real estate websites and compare property taxes between comparably sized populated villages of Tinley Park, Orland Park and Oak Lawn.
Why are comparable properties in neighboring suburban cook county towns paying, in many instances, 30-60% less than Tinley Park property taxes?"
Ways to protest/appeal your real estate taxes
As a first and highly effective appeals option, contact your local township where you can ask questions about your tax bill and also file an appeal locally. Many residents report a positive experience working with their township assessors. Township Assessors serving Tinley Park residents include:
The appeals process is something every property owner can manage on their own, without legal support or costs. You can find all of the data needed for your real estate tax appeal/protest online for free through public records. 66% of individual appeals saw a REDUCTION in their property taxes as last reported by the Cook County Board of Review. This is evidence that property values and property descriptions used to calculate our real estate taxes are incorrect on a majority of filed appeals, and most likely on properties not appealed too.
The goal of appealing is to ensure that your property is accurately assessed and not over assessed in value. Click here to read a taxpayer's summary on the property tax appeal process.
To begin research on neighboring properties to use in your assessment valuation research, type in neighboring addresses at one of the county links below, and see how your assessment compares to neighboring properties. Ensure that your assessment lists the correct information (attached/detached garage, finished/unfinished basement, etc), and then compare to neighboring, comparable properties. You will want to highlight neighboring properties that are similar (or exact) in age, build, rooms, bathrooms, lot size etc. to your property.
Here are links to start the property comparisons:
Additional details pertaining to Cook and Will County appeals processes are listed below.
The goal of appealing is to ensure that your property is accurately assessed and not over assessed in value. Click here to read a taxpayer's summary on the property tax appeal process.
To begin research on neighboring properties to use in your assessment valuation research, type in neighboring addresses at one of the county links below, and see how your assessment compares to neighboring properties. Ensure that your assessment lists the correct information (attached/detached garage, finished/unfinished basement, etc), and then compare to neighboring, comparable properties. You will want to highlight neighboring properties that are similar (or exact) in age, build, rooms, bathrooms, lot size etc. to your property.
Here are links to start the property comparisons:
- Cook County Property/PIN Search: http://www.cookcountyassessor.com/Search/Property-Search.aspx
- Will County Property/PIN Search: http://www.willcountysoa.com/search_address.aspx
Additional details pertaining to Cook and Will County appeals processes are listed below.
Cook County
All townships within Cook County have two opportunities each year to protest or appeal the assessed valuation on their property. The first opportunity to file an appeal is through the Cook County Assessor’s Office, which establishes a yearly calendar to assign specific dates during which each township is open to file appeals. At the beginning of each tax year, the Assessor’s Office displays a tentative filing date for each township. As the year progresses, the calendar is updated to reflect the actual appeal filing period. A taxpayer may file an appeal only when the township filing period has been established. This filing period lasts approximately 30 days.
The appeals calendar is available on the County Assessor’s website, or taxpayers may call the County Assessor at (312) 443-7550. Taxpayers may also call their local Township Assessor’s Office (see links above) for more information.
The second opportunity to file an appeal is through the Cook County Board of Review. The Board of Review also publishes a yearly calendar to assign specific dates during which residents of each township may file appeals. This filing period also lasts approximately 30 days. The Board of Review calendar, however, is not updated until just prior to each township’s period to file appeals. This calendar may be viewed online or you may call the Board of Review at (312) 603-5542 for appeal filing date information. Taxpayers may also call their local Township Assessor’s Office (see links above) for more information.
Will County
Per the Will County Treasurer website: The Will County Treasurer’s Office does not calculate your property tax bill. A taxing district (such as your school district) files a levy, the township assessor assesses your property, and the county clerk extends (calculates) your taxes. The Treasurer’s office only is responsible for mailing you a bill and collecting the tax.
If you don’t agree with your assessment, we strongly recommend that you discuss your assessment with your Township Assessor before you file a complaint (Click here for a list of Township Assessors). If you would like to file a complaint after speaking with your assessor, you may file an appeal with the Will County Board of Review.
For details about filing an appeal, you should contact the Will County Supervisor of Assessment. You can read rules of the Assessment Appeals Process here.
Contribute:
Post Guidelines: Tinley Taxpayers welcome all Tinley Park residents and businesses to contribute data, research and information to assist in the movement to have property taxes reduced through lower Village and School spending. Content posted on this page is expected to adhere to the conduct guidelines. Content that violates these guidelines is not tolerated.
Page Links:
Home Page
Property Taxes
Village of Tinley Park Data
Stop Taxpayer-funded Developments
Tinley Park Schools Data
The Reserve
Salary Graphs
Legislators
Govt. Transparency
How did we get here?
How can we fix this?
Imagine If
Who we are
TIP LINE
Taxpayer Greivances
Collaborate
Open Forum
Sources
Downloads
FAQ's
